Singapore · Open to internships and junior roles

Creative developer / AI + data products

I build interfaces for systems that show their work.

I turn citations, risk models, and market signals into products people can inspect—not just trust.

Grounded AI Creative tooling Financial systems Interfaces with evidence

Selected systems / 2026

The work is
the argument.

Four products, each reduced to the interaction that matters most.

01Explainable AI

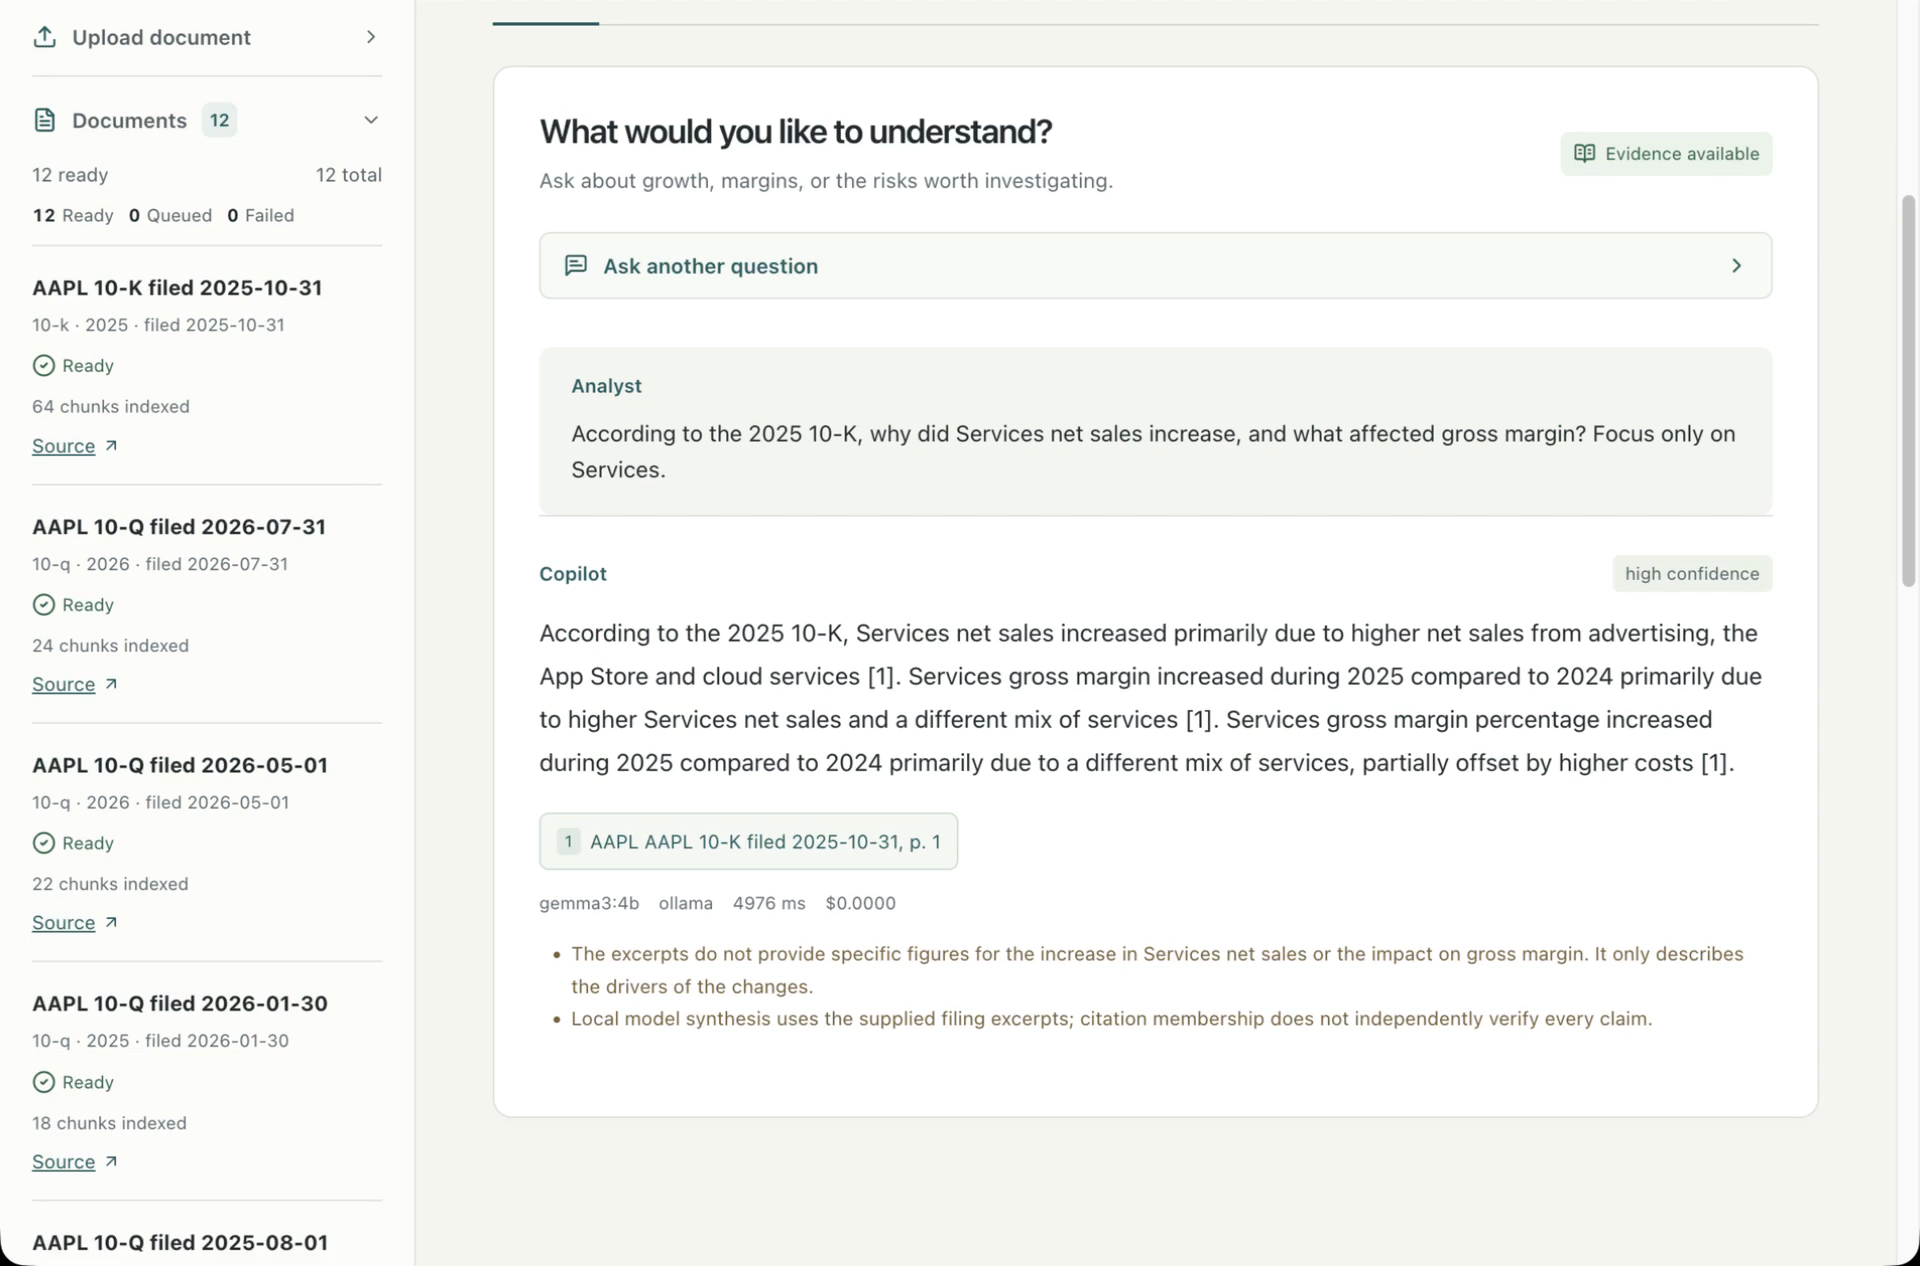
Ask filings.
Inspect every claim.

An equity-research workspace that ingests SEC filings, retrieves source chunks, and attaches evidence to generated answers. When the corpus cannot support a claim, the limitation stays visible.

  • React
  • FastAPI
  • Cited RAG
  • Evaluation
RESEARCH / NVDADETERMINISTIC DEMO SNAPSHOT
Q

What is driving Data Center growth, and what could constrain it?

GROUNDED ANSWERMEDIUM CONFIDENCE

The cited context points to accelerated Data Center demand as the main driver, especially GPU platforms used for AI training and inference.

Demand concentration, supply constraints, export controls, and rapid technology transitions may affect revenue timing and gross margin.

SOURCE 01NVDA FY2025 Form 10-K
Section
Management’s Discussion and Analysis
Page
42
Relevance
0.89
“Data Center revenue increased primarily from demand for the NVIDIA Hopper GPU computing platform used for training and inference of generative AI models.”
SOURCE 02NVDA FY2025 Form 10-K
Section
Risk Factors
Page
17
Relevance
0.81
“Demand concentration, supply constraints, export controls, and rapid technology transitions may affect revenue timing and gross margin.”
LIMITATION

A full multi-quarter margin bridge requires the latest indexed 10-Q and earnings transcript.

Select a citation marker to inspect the evidence.

02Risk interface

Turn a portfolio into an explainable risk memo.

An API-first risk engine that calculates volatility, VaR, expected shortfall, concentration, variance contribution, and scenario stress—then explains what deserves attention.

  • Python
  • FastAPI
  • Risk analytics
  • Stress tests
RISK ENGINE / SAMPLE ANALYSISINLINE PRICE HISTORY
68/100
RISK SCORE

Broad US equity is the largest mapped exposure at 45%.

Annualized volatility22.8%
Daily VaR 95%−0.64%
Expected shortfall−0.73%
Worst stress−7.6%
TOP EXPOSURESSPY / TLT / GLD / XLE / BTC
Broad US equity45%
Long-duration bonds25%
Gold defensive15%
RATES RISE SHARPLY

Estimated −7.6% impact. Duration and broad-equity exposure move against the portfolio together.

Computed from the project’s deterministic sample inputs; not live market data.

03Decision dashboard

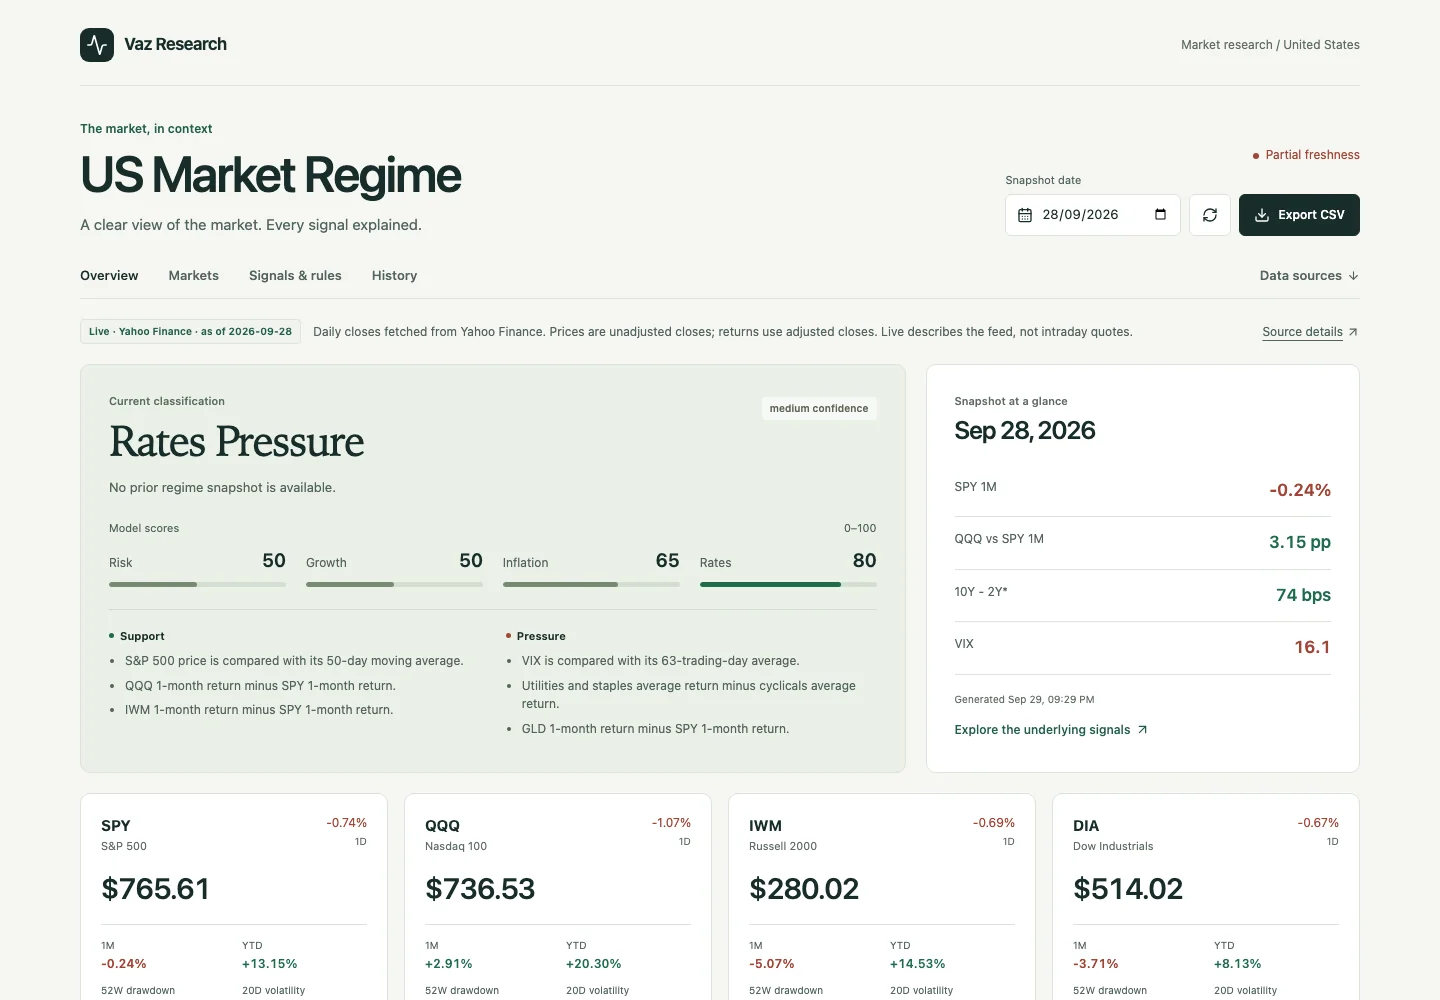
A market label that shows its math.

A macro dashboard that makes the route from inputs to regime classification explicit—complete with freshness checks, provenance, pressure signals, and known data gaps.

  • React
  • TypeScript
  • FastAPI
  • Data provenance
REGIME / 24 JUN 2026FIXED · STALE BY DESIGN
CURRENT CLASSIFICATION

Mixed
Transition

CONFIDENCEMEDIUM
Risk58
Growth64
Inflation54
Rates pressure61
SUPPORTING

S&P 500 above 50-day trend

Nasdaq leading over one month

PRESSURE

Small caps lag large caps

10Y yield up 22 bps in one month

Deterministic seeded snapshot. Values are internally consistent examples, not investment data.

04Diagnostic toolkit

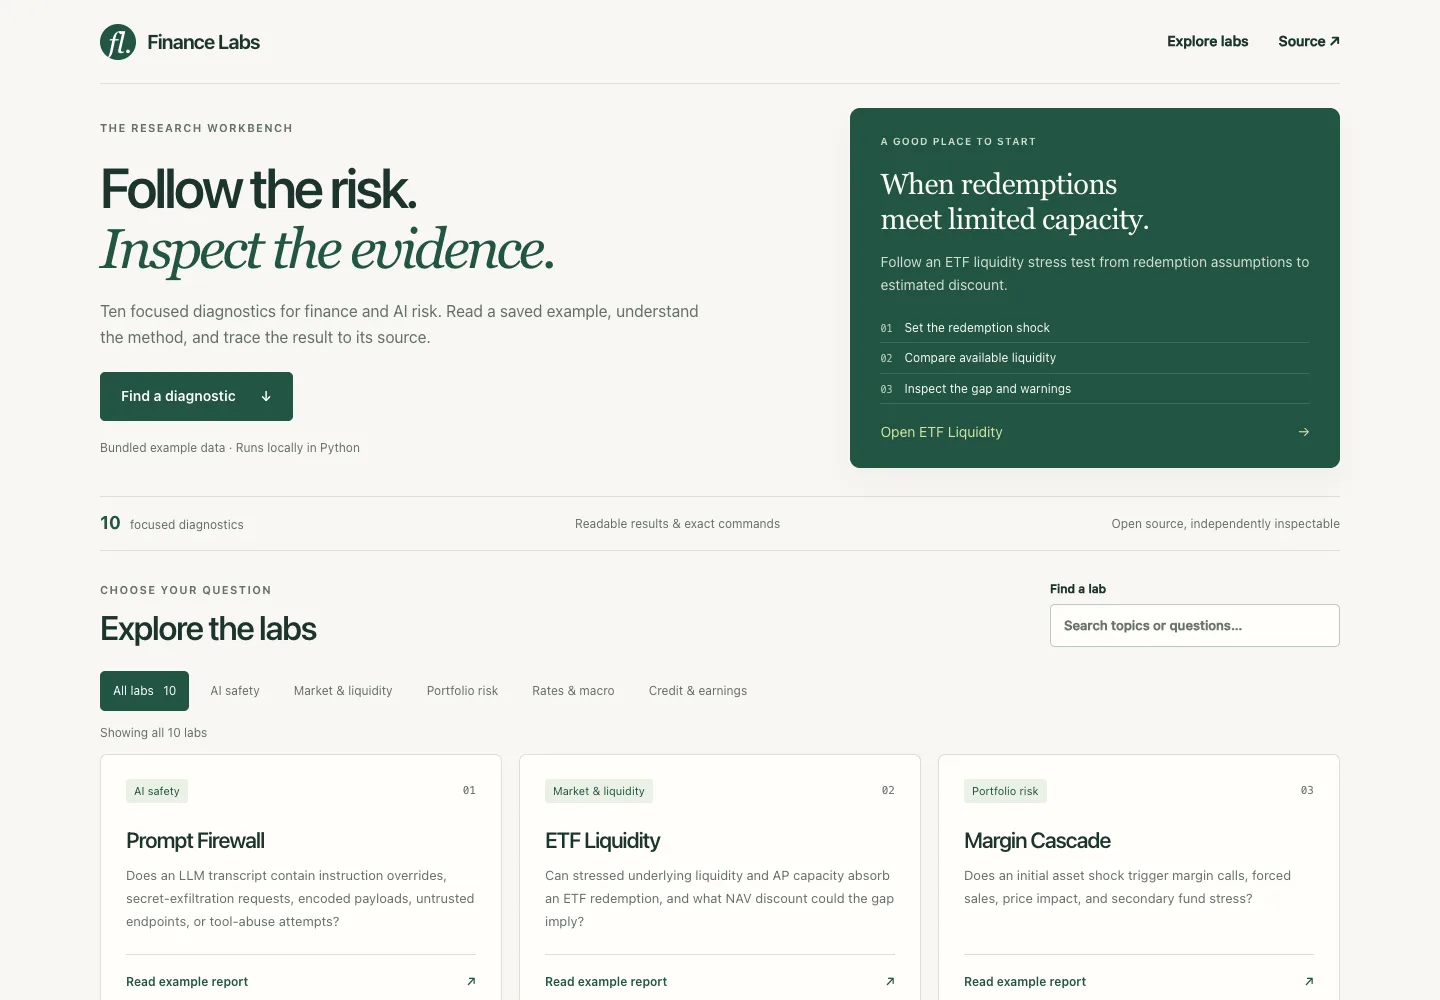
Ten diagnostics.
Real output.
No setup.

A collection of offline, test-covered finance diagnostics. The gallery publishes the actual CLI output, so every claim has an artifact behind it.

  • Python
  • CLI tooling
  • Test coverage
  • Static publishing
jv@finance-labs: ~/reports80×24

$ finance-labs margin-cascade --report

# Margin Cascade Report

Rounds simulated          2
Total forced liquidation  $7,142
Systemic risk score        41.35 / 100
Most stressed fund         Beacon

FINAL PRICE MOVE
ALPHA   100.00 → 73.53     −26.5%
BETA     58.00 → 55.12      −5.0%
GAMMA    35.00 → 32.20      −8.0%

✓ report written to captures/margin-cascade.txt

More experiments

Other work,
same standard.

Operating principles

Trust is an
interface problem.

The output is only half the product. The other half is showing where it came from, how it was tested, and where it stops being reliable.

  1. 01 / GROUND

    Grounded, or it doesn’t ship.

    Generated claims trace to source chunks. When evidence is weak, the system says so.

  2. 02 / TEST

    Evaluated, not vibe-checked.

    Golden sets, regression scoring, and adversarial cases arrive before trust does.

  3. 03 / EXPOSE

    Honest about failure modes.

    Limitations stay visible because good products help people calibrate confidence.

About / Contact

I’m Johan—computer science + quantitative finance at NUS.

Based in Singapore, I work where creative development meets explainable AI, data interfaces, and financial systems. I’m looking for an internship or junior role on a small team that cares about craft and ships.

Creative developerAI productEvaluationFintechResearch tooling

Have a hard interface problem?

v.johan2234@gmail.com